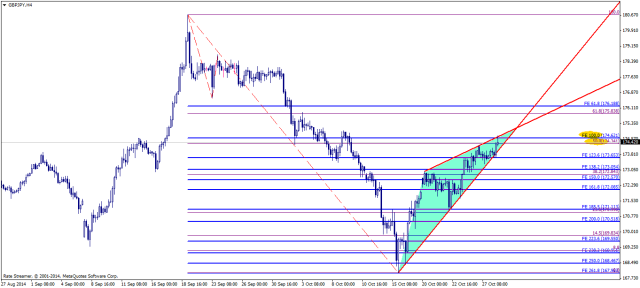
Rising Wedge
Conversely, a rising wedge is a bearish pattern that signals that the security is likely to head in a downward direction. The trendlines of this pattern converge, with both trendlines slanted in an upward direction.
Figure 2: Rising wedge pattern Again, the price movement is bounded by the two converging trendlines. As the price moves towards the apex of the pattern, momentum is weakening. A move below the lower support would be viewed by traders as a reversal in the upward trend.
As the strength of the buyers weakens (exhibited by their inability to take the price higher), the sellers start to gain momentum. The pattern is complete, with the sellers taking control of the security, when the price falls below the supporting trendline.
GBPJPY chart is inside
50 fib from last downswing move (“to continue trend move, stock should fill 50 percent correction” from textbook) + 100 FE + upper edge of rising wedge

